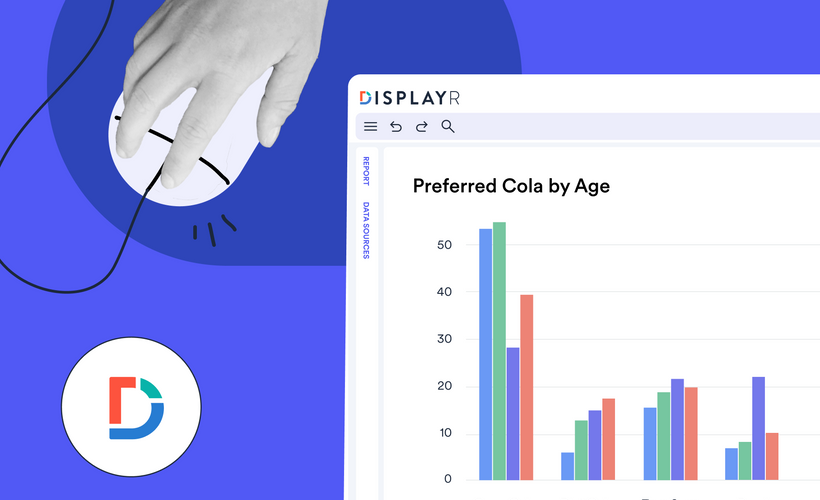
About the Course
Displayr is a revolution in survey analysis software. Designed by market researchers for market researchers, it is unrivaled in terms of time-saving and value-adding features (we've audited it alongside the other main products available).
This course will equip you with foundational skills in Displayr to set you up to do work well (there are or will be other courses to take you to an advanced level, should you choose). We are confident you will see immediate gains in productivity and the quality of your reporting.
This course covers:
- Getting your data into Displayr, in preparation to unleash its power.
- Manipulating data, setting the stage for insightful analyses and discoveries.
- Quickly creating tables and crosstabs, transforming data into meaningful insights.
- Data visualization, enabling you to communicate complex ideas and captivate your audience.
- Reporting capabilities, giving you the flexibility to publish online, or PowerPoint or PDF documents.
Course Instructor
Andrew Kelly
Instructor
Over 30 years experience in quantitative research, including director roles at a leading multi-national agency. Highly regarded for his skills in finding the story in data and communicating it in an effective way.
Course Progress
Course Outline
-
Getting Started
- Course welcome and preparation
- Displayr basics (in a nutshell)
- Exercise: Your turn to create a document
- More about documents
-
Preparing Your Data
- More on connecting data
- Working with variable sets
- Manipulating data
- Quiz: Checking and editing data
- Some data preparation tips
-
Analyzing Your Data
- Summary tables and crosstabs
- Exercise: Create and manipulate a crosstab
- More on significance testing
- Creating and applying filters
- Weighting
- Creating and modifying visualizations
- Exercise: Creating and filtering a visualization
-
Publishing Your Report
- Publishing your report
- Exercise: Updating a data set (aka "Displayr magic")
-
Displayr Certification
- Displayr Certification Exam
About the Course
Displayr is a revolution in survey analysis software. Designed by market researchers for market researchers, it is unrivaled in terms of time-saving and value-adding features (we've audited it alongside the other main products available).
This course will equip you with foundational skills in Displayr to set you up to do work well (there are or will be other courses to take you to an advanced level, should you choose). We are confident you will see immediate gains in productivity and the quality of your reporting.
This course covers:
- Getting your data into Displayr, in preparation to unleash its power.
- Manipulating data, setting the stage for insightful analyses and discoveries.
- Quickly creating tables and crosstabs, transforming data into meaningful insights.
- Data visualization, enabling you to communicate complex ideas and captivate your audience.
- Reporting capabilities, giving you the flexibility to publish online, or PowerPoint or PDF documents.
Course Outline
-
Getting Started
- Course welcome and preparation
- Displayr basics (in a nutshell)
- Exercise: Your turn to create a document
- More about documents
-
Preparing Your Data
- More on connecting data
- Working with variable sets
- Manipulating data
- Quiz: Checking and editing data
- Some data preparation tips
-
Analyzing Your Data
- Summary tables and crosstabs
- Exercise: Create and manipulate a crosstab
- More on significance testing
- Creating and applying filters
- Weighting
- Creating and modifying visualizations
- Exercise: Creating and filtering a visualization
-
Publishing Your Report
- Publishing your report
- Exercise: Updating a data set (aka "Displayr magic")
-
Displayr Certification
- Displayr Certification Exam
Course Instructor
Andrew Kelly
Instructor
Over 30 years experience in quantitative research, including director roles at a leading multi-national agency. Highly regarded for his skills in finding the story in data and communicating it in an effective way.
 More Courses Coming Soon - Be the First to Know.

